Most companies treat freight claims as a recovery exercise: damage happens, you file, you recover what you can, you move on. The claim is a cost of doing business – an unpleasant one, but unavoidable.
That mindset leaves enormous value on the table. Freight claims data, when properly captured and analyzed, tells you which carriers are costing you money, which lanes are generating the most damage, which products are most vulnerable, and which seasons amplify the problem. It’s negotiation leverage, a prevention roadmap, and a P&L improvement tool all in one. Yet the Descartes 2025 Transportation Management Benchmark Survey found that 43% of shippers still rely on spreadsheets and email for shipment visibility, with only 17% fully automated.
This guide shows you how to move freight claims from a cost center to a strategic asset: the five KPIs your dashboard should track, how to use claims data in carrier negotiations with real examples, and how to shift from reactive recovery to predictive prevention. For the software that makes this possible, see our freight claims software comparison. For the financial case to invest in analytics capability, see our ROI calculator.
What Are the 5 KPIs Every Freight Claims Dashboard Should Track?
The five KPIs that transform claims data into actionable intelligence are:
- Claims Filing Rate (claims as a percentage of total shipments)
- Recovery Rate (dollars recovered versus dollars claimed)
- Average Resolution Time (days from filing to settlement)
- Denial Rate (percentage of claims denied on first submission)
- Claims Cost Per Shipment (total claims value segmented by carrier and lane).
Tracking these weekly gives you a real-time performance picture that identifies problems before they compound. |
KPI 1: Claims Filing Rate
What it measures: The number of claims filed as a percentage of total shipments in a given period.
Benchmark: Below 2% is healthy for most operations. Truckload shipments typically see 0.5-2% damage rates; LTL runs 2–5% due to multiple handling touchpoints.
Why it matters: A rising filing rate signals a systemic problem. It could be a carrier handling issue, a packaging failure, a seasonal pattern, or a new lane with elevated risk. A falling rate confirms that your prevention efforts are working. Track this weekly, segmented by carrier and lane, to catch trends before they become crises.
Watch out for: A filing rate that seems “too low” may actually indicate that your team isn’t filing eligible claims. The CorePiper 2026 report found that fewer than 50% of eligible freight claims are actually filed, meaning most companies are leaving recoverable money on the table.
KPI 2: Recovery Rate
What it measures: Dollars recovered divided by dollars claimed, expressed as a percentage.
Benchmark: Target 70% or higher. Industry averages range from 35-45% under manual processes to 70-85% with purpose-built claims software. Managed service providers like nVision Global report rates as high as 87% across nearly 8,000 claims.
Why it matters: Recovery rate is the single most important financial KPI in claims management. Every percentage point improvement drops directly to the bottom line. If you file $60,000 in claims per month, moving from 40% to 75% recovery adds $21,000 per month ($252,000 annually).
Watch out for: Track recovery rate by claim type (damage, loss, shortage) and by carrier. A strong overall rate can mask a specific carrier or claim type where recovery is consistently poor.
KPI 3: Average Resolution Time
What it measures: Days from claim submission to final payment, denial, or settlement.
Benchmark: Under 30 days is the target. The industry average under manual processing is 47 days, with significant mode variation. LTL claims average 60-90 days, parcel claims 14-30 days. Automated processes cut this to 14-21 days.
Why it matters: Resolution time directly affects cash flow and working capital. A claim that takes 90 days to resolve ties up that cash for three months. Faster resolution also correlates with higher recovery. Claims that drag out tend to settle for less as documentation loses freshness and carrier attention wanes.
Watch out for: An estimated 30% of filed claims are abandoned before final payout, not because they were denied, but because the team ran out of bandwidth to follow up. Track the abandonment rate as a sub-metric of resolution time.
KPI 4: Denial Rate
What it measures: Percentage of claims denied on first submission.
Benchmark: Below 20% overall. LTL denial rates run 50–60%, significantly higher than FTL (20-35%) and parcel (30-45%). If your denial rate is above these benchmarks, your filing process likely has a documentation or deadline gap.
Why it matters: Denial rate is a diagnostic metric. It tells you where your process is breaking down. The top denial triggers are well-documented: incomplete documentation (35-40%), missed deadlines (20-25%), no damage notation on the POD (15-18%), and packaging cited as cause (~25%). Knowing which trigger is driving your denials tells you exactly what to fix.
KPI 5: Claims Cost Per Shipment
What it measures: Total claims value (filed) divided by total shipment count, segmented by carrier, lane, and commodity.
Benchmark: This metric is company-specific, so there’s no universal benchmark. The value is in tracking it over time and by segment. A rising cost per shipment on a specific lane or with a specific carrier is a red flag.
Why it matters: This is the metric that connects claims to the broader transportation P&L. It answers the question every CFO asks: “What is freight damage actually costing us per shipment?” Segment it by carrier to identify which carrier relationships have the highest total cost of service (rates plus damage costs). Segment it by lane to identify routes with elevated risk.
KPI Dashboard Quick Reference
| KPI |
Benchmark |
Tracking Frequency |
Primary Segmentation |
| Claims Filing Rate |
< 2% of shipments |
Weekly |
By carrier, by lane |
| Recovery Rate |
≥ 70% |
Weekly |
By carrier, by claim type |
| Avg. Resolution Time |
< 30 days |
Weekly |
By carrier, by mode |
| Denial Rate |
< 20% overall |
Bi-weekly |
By denial reason, by carrier |
| Claims Cost Per Shipment |
Trend down over time |
Monthly |
By carrier, by lane, by commodity |
How Do You Use Freight Claims Data to Negotiate Better Carrier Rates?
| Claims data is negotiation leverage that most shippers underutilize. A 12-18 month lookback of carrier-level claims data segmented by damage rate, denial rate, resolution time, and total claims cost gives you a documented, data-backed position in contract renewals and quarterly business reviews. Shippers who bring this level of specificity to carrier negotiations consistently secure better outcomes: rate concessions, performance guarantees, or dedicated equipment commitments. |
Build the Carrier Scorecard
The foundation of data-driven carrier negotiation is a carrier performance scorecard that tracks claims-specific metrics alongside standard operational KPIs. For each carrier in your network, compile:
- Damage rate: claims filed as a percentage of shipments with that carrier
- Denial rate: percentage of claims that carrier denied on first submission
- Average resolution time: how long that carrier takes to pay or settle claims
- Total claims cost: the absolute dollar value of claims filed against that carrier
- Recovery rate: what percentage of filed value you actually recovered from that carrier
When you can show a carrier that their damage rate on your lanes is 4.2% versus a 1.8% average across your carrier network, that’s a specific, documented performance gap. As transportation spend consultant Zero Down Supply Chain Solutions explains, shippers who enter renewal conversations armed with a 12-18 month freight audit lookback have “documented leverage” that transforms the negotiation from price-focused to performance-focused.
What to Ask For
Claims data supports four types of negotiation outcomes:
- Rate concessions: A carrier with a higher-than-average damage rate is costing you more than their base rate suggests. The total cost of service (rate + claims cost) is the number that matters. Use it to negotiate a rate reduction that reflects the true cost of doing business with that carrier.
- Performance guarantees: Negotiate contractual damage rate thresholds. If the carrier exceeds a specified damage percentage on your lanes, they owe credits or rate adjustments. These clauses only work if you have the data to monitor compliance.
- Dedicated equipment or handling protocols: For high-value or fragile commodities, claims data can justify the cost of dedicated trailers, top-load-only requirements, or no-stack agreements. The carrier is more likely to agree when you can show the claims cost their current handling generates.
- Volume shifts: The strongest leverage is the willingness to move volume. If Carrier A’s damage rate is three times Carrier B’s on the same lane, shifting volume is both a negotiation tactic and a genuine prevention strategy.
Real-World Examples
The economics of data-driven carrier negotiation are well-documented across the logistics industry. Cabot Creamery used ShipperGuide’s procurement analytics platform to benchmark freight costs against market rates and identify lanes where transportation costs exceeded market conditions. By focusing contract negotiations on those specific opportunities, Cabot reported approximately $1 million in freight cost savings during its first year using the platform.
While that example centers on rate analytics, the principle applies directly to claims data: carriers whose damage performance is below your network average are generating a quantifiable cost above their base rate. The claims analytics dashboard in FreightClaims.com surfaces exactly this: damage rate, denial rate, resolution time, and total claims cost by carrier, so you walk into every QBR and contract renewal with carrier-specific, documented evidence of performance gaps.
How Can Claims Analytics Shift You from Recovery to Prevention?
| The highest-ROI application of claims analytics isn’t recovering more dollars. It’s preventing claims from happening in the first place. By analyzing patterns in claims data (seasonal spikes, lane-specific risk, commodity vulnerabilities, carrier performance trends), shippers can proactively adjust packaging, routing, and carrier selection before damage occurs. |
Pattern 1: Seasonal Spikes
Claims data consistently shows seasonal patterns. Q4 holiday surge increases damage claims as carriers handle higher volumes with temporary labor and tighter delivery windows. Summer months bring temperature-related contamination claims for perishable and pharmaceutical freight. Winter brings weather-related delays and cold-chain failures. When you can see these patterns in your historical data, you can prepare for them: increase packaging specifications before peak season, add temperature monitoring on lanes with summer contamination history, and build buffer time into winter transit schedules.
Pattern 2: Lane-Specific Risk
Some lanes generate disproportionately more claims than others. The causes vary, for example, longer transit times, more handling points (especially for LTL through hub-and-spoke networks), specific terminal operations with known issues, or geographic factors like mountain passes or rough road conditions. When your analytics identify a high-risk lane, you have options: change carriers on that lane, adjust packaging specifications, add monitoring devices, or renegotiate the rate to reflect the true cost of service including claims.
Pattern 3: Commodity Vulnerabilities
Different products have fundamentally different damage profiles. Electronics see 3-7% damage rates; glass and ceramics run 4-8%. Your claims data reveals which of your specific products are most vulnerable, and whether the root cause is packaging, handling, carrier selection, or transit conditions. A product with a consistently elevated damage rate needs a packaging review, an ISTA transit test, or a dedicated carrier solution, and the claims data tells you which intervention to prioritize.
Pattern 4: Carrier Performance Trends
A carrier’s damage rate isn’t static, rather it trends over time. A carrier that performed well for two years but shows a rising damage rate over the last two quarters may be experiencing operational issues: driver turnover, equipment aging, terminal overcrowding. Your analytics should track carrier performance over rolling 12-month windows, not just point-in-time snapshots. A trending deterioration is an early warning signal that justifies a conversation with the carrier’s account team before the problem shows up as a spike in your claims. For more on using analytics as a decision-making tool, see the benefits of analytics in freight claims management.
The Compounding Effect of Prevention
Prevention generates compounding returns because every claim you prevent eliminates not just the claim payout, but the filing labor, the follow-up time, the administrative cost, and the carrier relationship friction. The FreightAmigo packaging optimization case study – a 60% claim reduction through NMFC-compliant packaging – saved $250,000 annually not just in recovered claim value but in total cost of claims including labor and operational disruption. Industry-wide, the Synchrogistics LTL Claims Index shows that the overall LTL claims ratio has declined nearly 40% over five years (0.588% to 0.345%), demonstrating that sustained, data-driven prevention produces real, measurable results at scale.
What Do You Need to Build a Freight Claims Analytics Capability?
An effective freight claims analytics capability requires three things:
- A centralized claims management platform that captures structured data on every claim (not spreadsheets)
- Consistent data hygiene practices (standardized carrier names, cause codes, commodity classifications)
- A regular cadence of review (weekly KPI monitoring, monthly trend analysis, quarterly carrier QBRs).
The platform does the heavy lifting; your team provides the judgment. |
Start with Clean, Centralized Data
Analytics is only as good as the data feeding it. If your claims live in spreadsheets, email threads, and filing cabinets, there’s no dataset to analyze. The first step is centralizing every claim in a single platform that captures structured fields: carrier name (standardized), shipment details, claim type, damage cause code, dollar amount, filing date, resolution date, and outcome. Purpose-built claims management platforms capture this data as a natural byproduct of filing without adding extra work.
Establish a Review Cadence
Data without review is just storage. Establish three review cycles:
- Weekly: Monitor the 5 KPIs at the dashboard level. Flag any metric that crosses a threshold (filing rate > 2%, denial rate > 25%, resolution time > 45 days). Take immediate action on exceptions.
- Monthly: Analyze trends across carrier performance, lane risk, and claim type. Identify the top three carriers and top three lanes driving the most claims. Assign root cause investigation to specific team members.
- Quarterly: Conduct carrier QBRs using the carrier scorecard. Present claims performance data alongside rate and service data. Use the quarterly review to negotiate performance improvements, rate adjustments, or volume shifts.
Connect Claims Data to the Broader Transportation P&L
Claims analytics becomes truly strategic when it’s connected to transportation spend data. A carrier’s base rate is only part of the cost of using that carrier. Add claims cost, and the total cost of service may tell a different story. A carrier with the lowest rate but the highest damage rate may actually be the most expensive option when you account for unrecovered losses, filing labor, and operational disruption. The CFO doesn’t see individual claims, they see transportation cost as a line item. Claims analytics gives that line item granularity.
Turn Your Claims Data into a Competitive Advantage
Freight claims analytics isn’t just a reporting feature, but a strategic capability that touches carrier negotiations, packaging engineering, lane optimization, and financial planning. The companies that do it well don’t just recover more money; they prevent more damage, negotiate better rates, and make smarter routing decisions.
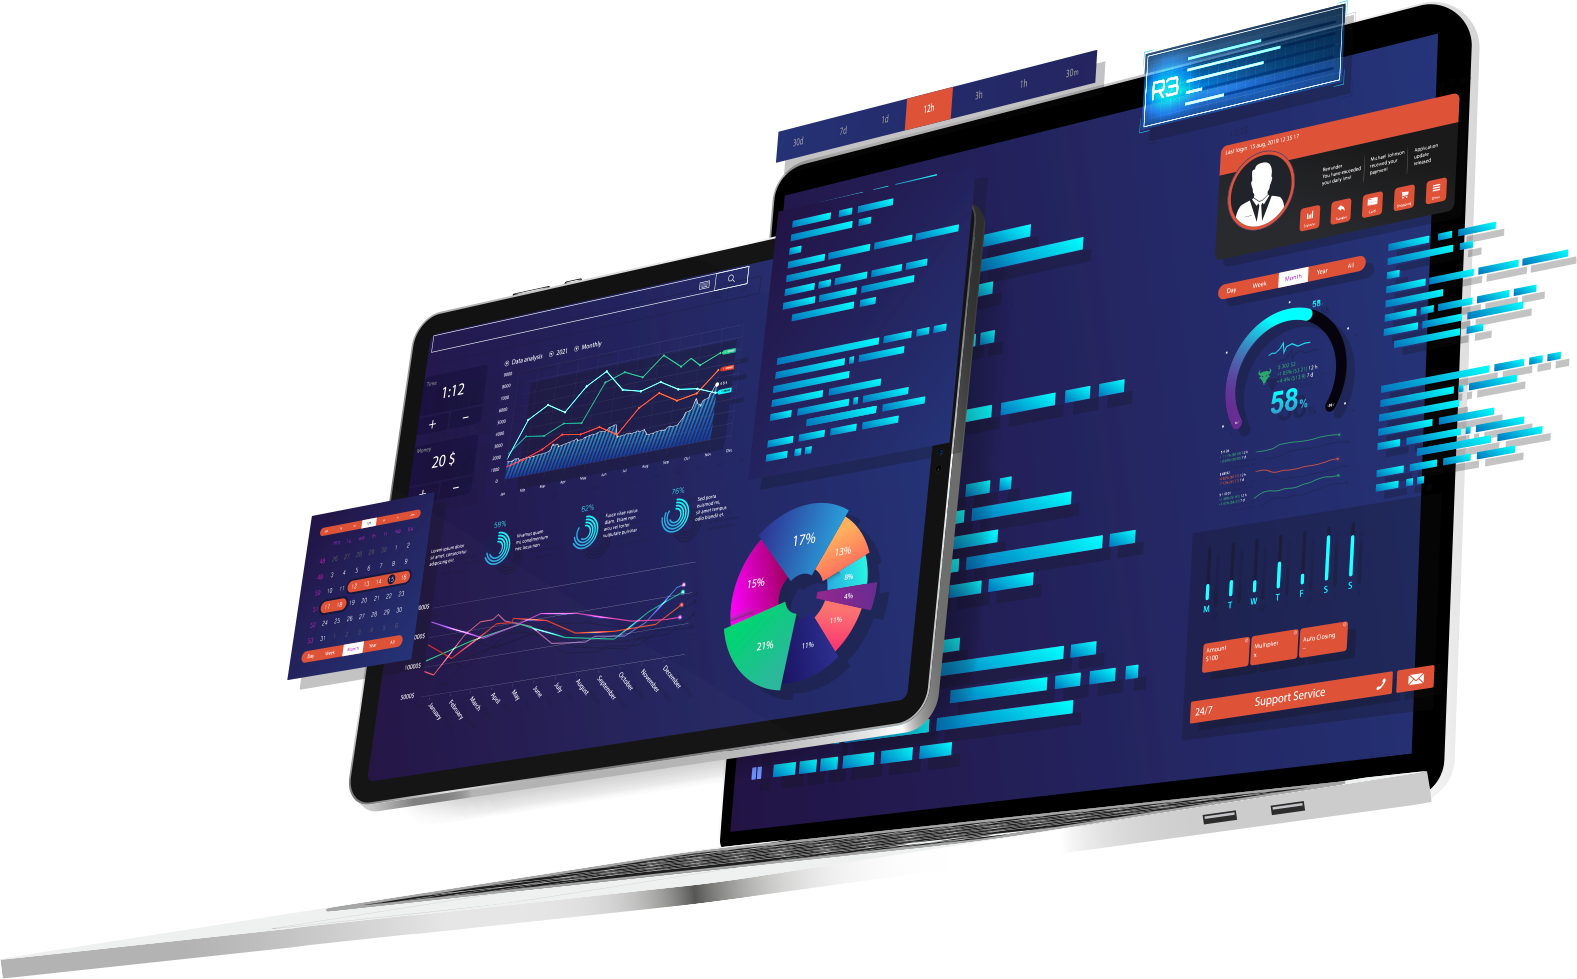
FreightClaims.com’s analytics dashboard surfaces all five KPIs in real time, tracks carrier performance over rolling windows, identifies seasonal and lane-specific patterns, and generates the carrier scorecards you need for every QBR. Every claim filed through the platform automatically feeds the analytics engine without extra data entry or manual report building.
Ready to see what your claims data is telling you? Book a demo and we’ll walk through your claims analytics in the platform.
Frequently Asked Questions About Freight Claims Analytics
What KPIs should I track for freight claims?
Five KPIs form the core of any claims dashboard: Claims Filing Rate (target: below 2% of shipments), Recovery Rate (target: 70%+), Average Resolution Time (target: under 30 days), Denial Rate (target: below 20%), and Claims Cost Per Shipment (track trends by carrier and lane). Monitor the first four weekly and Claims Cost Per Shipment monthly.
How can freight claims data help in carrier negotiations?
Claims data provides documented, carrier-specific evidence of performance gaps. Build a carrier scorecard tracking damage rate, denial rate, resolution time, and total claims cost. When you can show a carrier that their damage rate exceeds your network average by a specific margin, you have leverage for rate concessions, performance guarantees, or dedicated equipment commitments.
What is a good recovery rate for freight claims?
Target 70% or higher. Industry averages range from 35-45% for companies using manual processes to 70-85% for those using dedicated claims software. Managed service providers report rates as high as 87%. If your rate is below 50%, a process or technology gap is likely the cause.
How can claims analytics prevent future freight damage?
Claims analytics reveals patterns that point to root causes: seasonal spikes, lane-specific risks, commodity vulnerabilities, and carrier performance trends. By identifying these patterns, you can proactively adjust packaging, change carriers on high-risk lanes, add monitoring devices, or retrain dock teams before damage occurs.
What is the average freight claim resolution time?
The industry average under manual processing is 47 days from filing to final payment or denial, with significant variance by mode: LTL claims average 60-90 days, parcel claims 14-30 days, and FTL claims 30-60 days. Companies using automated claims platforms reduce this to 14-21 days on average.
How often should I review freight claims analytics?
Establish three review cycles: weekly dashboard monitoring of the 5 core KPIs, monthly trend analysis of carrier performance and lane risk, and quarterly carrier QBRs using the carrier scorecard. The weekly review catches emerging problems; the monthly review identifies patterns; the quarterly review drives negotiation and strategic decisions.
What claims software provides the best analytics?
Look for platforms that track all five core KPIs in real time, segment data by carrier, lane, mode, and commodity, and generate carrier scorecards for QBRs. FreightClaims.com’s analytics dashboard is built specifically for this purpose. For a full comparison of analytics capabilities across platforms, see our 2026 freight claims software comparison guide.